Playground
What is the playground?
The playground serves as the primary interface for executing and testing workflows in the web platform. It provides an intuitive environment where you can validate workflow behavior and debug individual components.
When you select a workflow from either the marketplace or your personal collection, the playground appears automatically. You can access the workflow editor by dragging the playground down or pressing 'Escape', and return to the playground by clicking the 'Run' button in the editor's bottom-left corner.
While primarily designed for testing and debugging, the playground also functions as a production-ready workflow execution interface. Its streamlined UI makes it a viable alternative to traditional chatbot interfaces like ChatGPT.
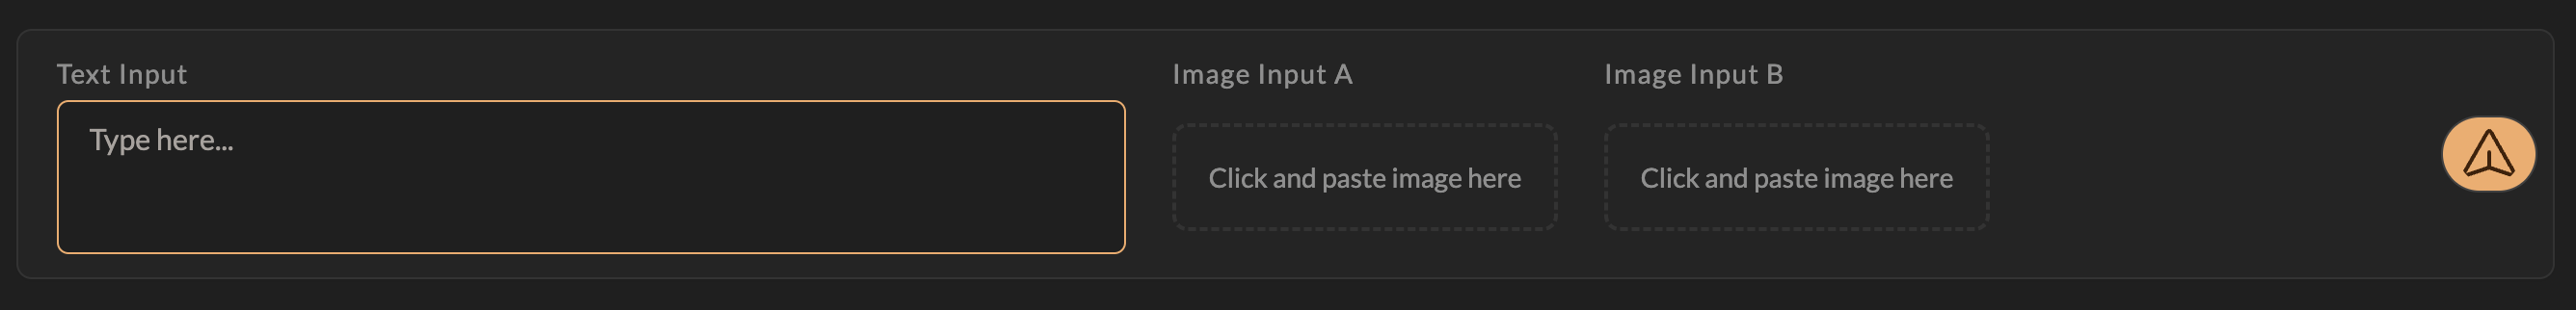
Inputs & Outputs
The playground dynamically generates input fields based on your workflow configuration, for example:
- Text Inputs appear as standard text fields
- Image Inputs display as rectangular drop zones for image uploads
Executing a workflow can be triggered by either pressing 'Enter' or clicking the 'Paper Airplane' button, which sends all input data as a single message. Upon completion, the workflow displays each output with its corresponding identifier label.
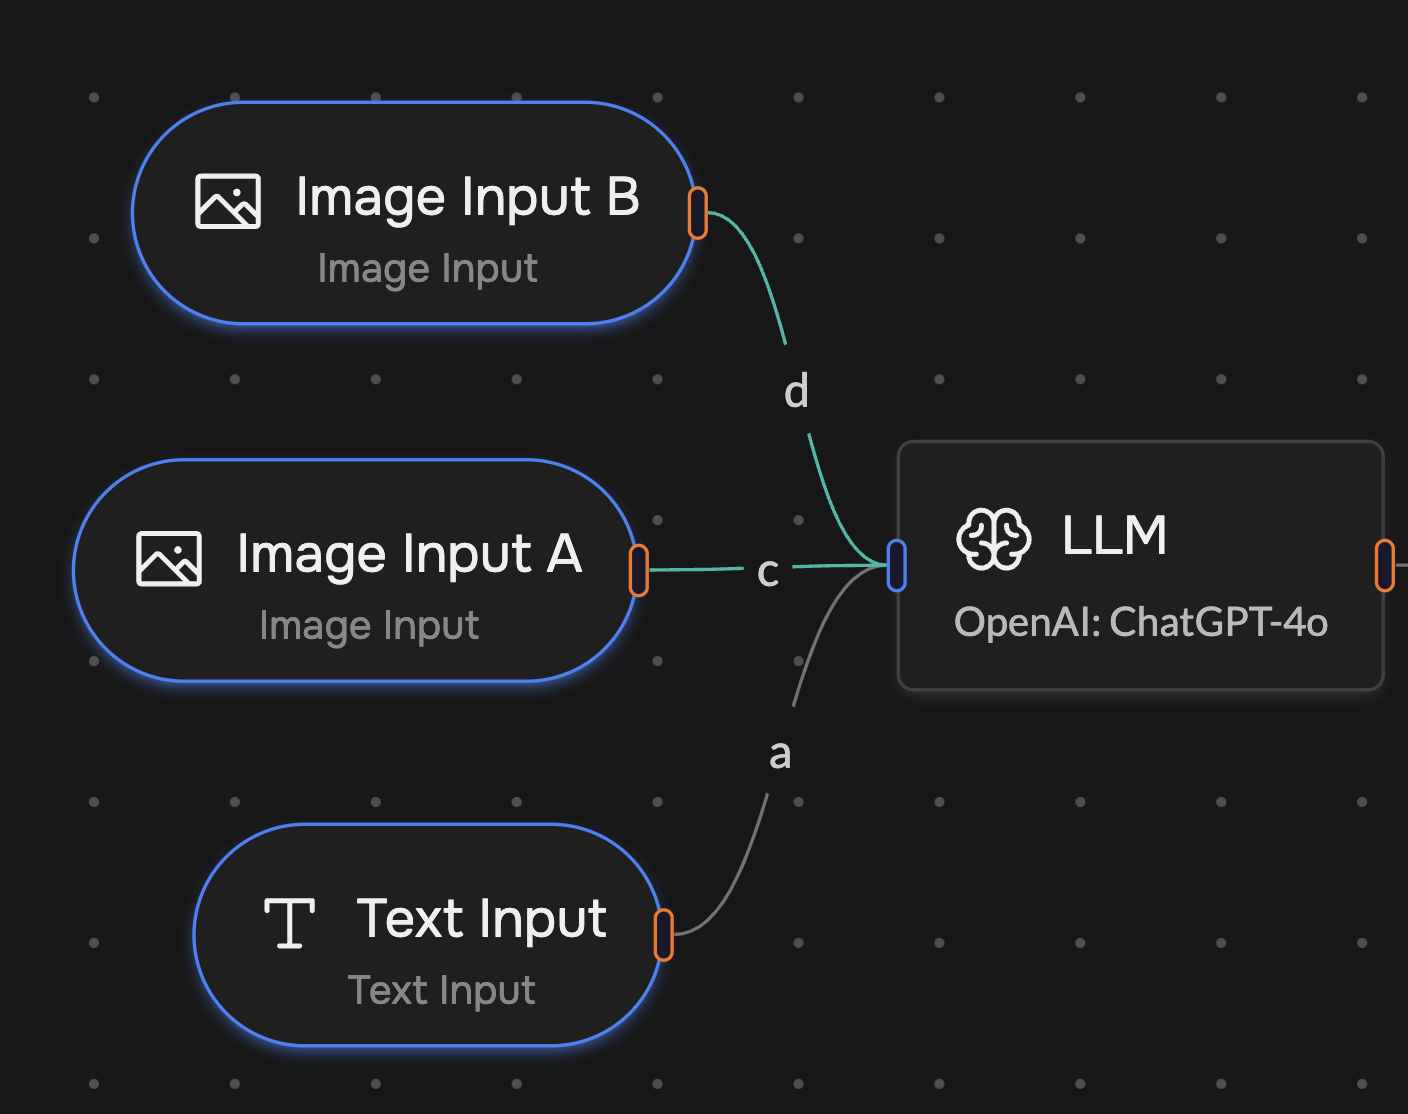
This example shows how each input component creates a dedicated field in the playground with a UI specifically designed for its data type.
Conversations
The playground maintains a conversation history similar to traditional chatbot interfaces, enabling continuous interactions. Important notes about conversations:
- LLM memory is determined by component settings
- Conversation history display doesn't guarantee LLM memory retention
- Each execution's complete context is preserved in the conversation
The playground conversation history not only records sessions inside the playground, but also maintains the conversation history of API calls. This feature is particularly useful for troubleshooting API-related issues by reviewing the conversation history.
Debugging
The playground provides detailed execution insights through 'Inference Summaries' - comprehensive logs generated after each component execution. These summaries include:
- Input and output data for each component
- Specialized interfaces for specific components (e.g., LLM component)
- Raw data access through the 'Basic Inference Summary' tab
This example demonstrates inference summaries for an LLM component. The 'Basic Inference Summary' tab shows the raw input and output data, while the formatted view provides a clearer way to debug LLM memories and interactions. Additionally, you can track resource usage by viewing the credits consumed and execution time for each component in the workflow.